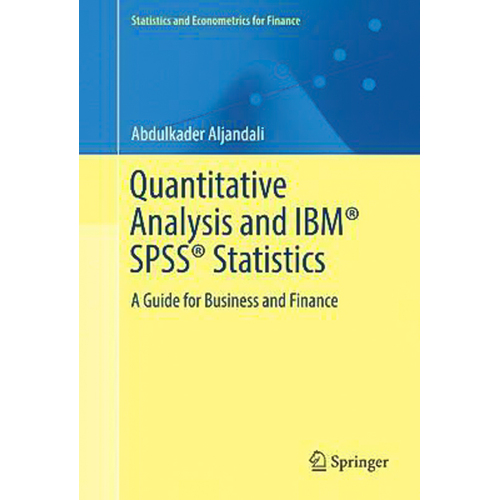
Quantitative Analysis and IBM (R) SPSS (R) Statistics Hardcover Book
A Guide for Business and Finance (Statistics and Econome
Quantitative Analysis and IBM (R) SPSS (R) Statistics: A Guide for Business and Finance (Statistics and Econometrics for Finance)
Author: Abdulkader AljandaliPublisher: Springer International Publishing AGCategory: Econometrics, Econometrics, Economic Statistics, Economic Statistics, Corporate Finance, Business Mathematics & Systems, Information Technology Industries, Probability & Statistics, Applied Mathematics, Database Design & TheoryBook Format: Hardcover
This guide is for practicing statisticians and data scientists who use IBM SPSS for statistical analysis of big data in business and finance. This is the first of a two-part guide to SPSS for Windows, introducing data entry into SPSS, along with elementary statistical and graphical methods for summarizing and presenting data. Part I also covers the rudiments of hypothesis testing and business forecasting while Part II will present multivariate statistical methods, more advanced forecasting methods, and multivariate methods.
IBM SPSS Statistics offers a powerful set of statistical and information analysis systems that run on a wide variety of personal computers. The software is built around routines that have been developed, tested, and widely used for more than 20 years. As such, IBM SPSS Statistics is extensively used in industry, commerce, banking, local and national governments, and education. Just a small subset of users of the package include the major clearing banks, the BBC, British Gas, British Airways, British Telecom, the Consumer Association, Eurotunnel, GSK, TfL, the NHS, Shell, Unilever, and W.H.S.
Although the emphasis in this guide is on applications of IBM SPSS Statistics, there is a need for users to be aware of the statistical assumptions and rationales underpinning correct and meaningful application of the techniques available in the package; therefore, such assumptions are discussed, and methods of assessing their validity are described. Also presented is the logic underlying the computation of the more commonly used test statistics in the area of hypothesis testing. Mathematical background is kept to a minimum.
Abdulkader Aljandali, Ph.D., is a Senior Lecturer in Quantitative Finance and Business Forecasting at Regent's University London. He acts as a visiting professor at overseas institutions in Canada, France, and Morocco.
Table Of Contents
1 Getting Started with SPSS1.1 Creation of an SPSS data file 1.1.1 The SPSS Data Editor 1.1.2 Entering the data 1.1.3 Saving the data file 1.2 Descriptive statistics 1.2.1 Some commonly used statistics 1.2.2 Levels of measurement 1.2.3 Descriptive statistics in SPSS 1.2.4 A discussion of results 1.3 Creation of a chart 1.4 Basic editing of a chart and saving it in a file 2 Graphics and Introductory Statistical Analysis of Data2.1 The boxplot 2.2 The histogram 2.3 The spread-level plot 2.4 Bar charts 2.5 Pie charts 2.6 Pareto charts 2.7 The drop-line chart 2.8 Line charts 2.9 Applying paneling to graphs 2.10 Data exploration via the EXPLORE routine 3 Frequencies and Crosstabulations3.1 Univariate frequencies 3.2 Crosstabulation of two variables3.3 Customising tables 4 Coding, Missing Values, Conditional and Arithmetic Operations4.1 Coding of data 4.2 Arithmetic operations 4.3 Conditional transforms4.4 The Autorecode facility 5 Hypothesis Tests Concerning Means5.1 A review of hypothesis testing 5.2 The paired t test5.3 The two sample t test5.4 The one-way analysis of variance 6 Nonparametric Hypothesis Tests6.1 The sign test 6.2 The Mann Whitney test 6.3 The Kruskal Wallis one way ANOVA 7 Bivariate Correlation and Regression7.1 Bivariate correlation 7.2 Linear least squares regression for bivariate data 7.3 Bivariate correlation and regression in SPSS 8 Multivariate Regression8.1 The assumptions underlying regression 8.2 Selecting the regression equation 8.3 Multivariate regression in SPSS 8.4 The Cochrane-Orcutt procedure for tackling autocorrelation 9 Logistic Regression 9.1 Binary Logistic Regression 9.2 The logistic model in SPSS 9.3 A financial application of the logistic model 9.4 Multinomial Logistic RegressionAbout Abdulkader Aljandali
Abdulkader Aljandali, Ph.D., is a Senior Lecturer in Quantitative Finance and Business Forecasting at Regent's University London. He acts as a visiting professor at overseas institutions in Canada, France, and Morocco.| SKU | BK-9783319455273 |
| Barcode # | 9783319455273 |
| Brand | Springer International Publishing AG |
| Artist / Author | Abdulkader Aljandali |
| Shipping Weight | 0.5500kg |
| Shipping Width | 0.160m |
| Shipping Height | 0.010m |
| Shipping Length | 0.240m |
| Assembled Length | 23.500m |
| Assembled Height | 1.300m |
| Assembled Width | 15.500m |
| Type | Hardcover |


